Wind farm supervision & maintenance dashboard
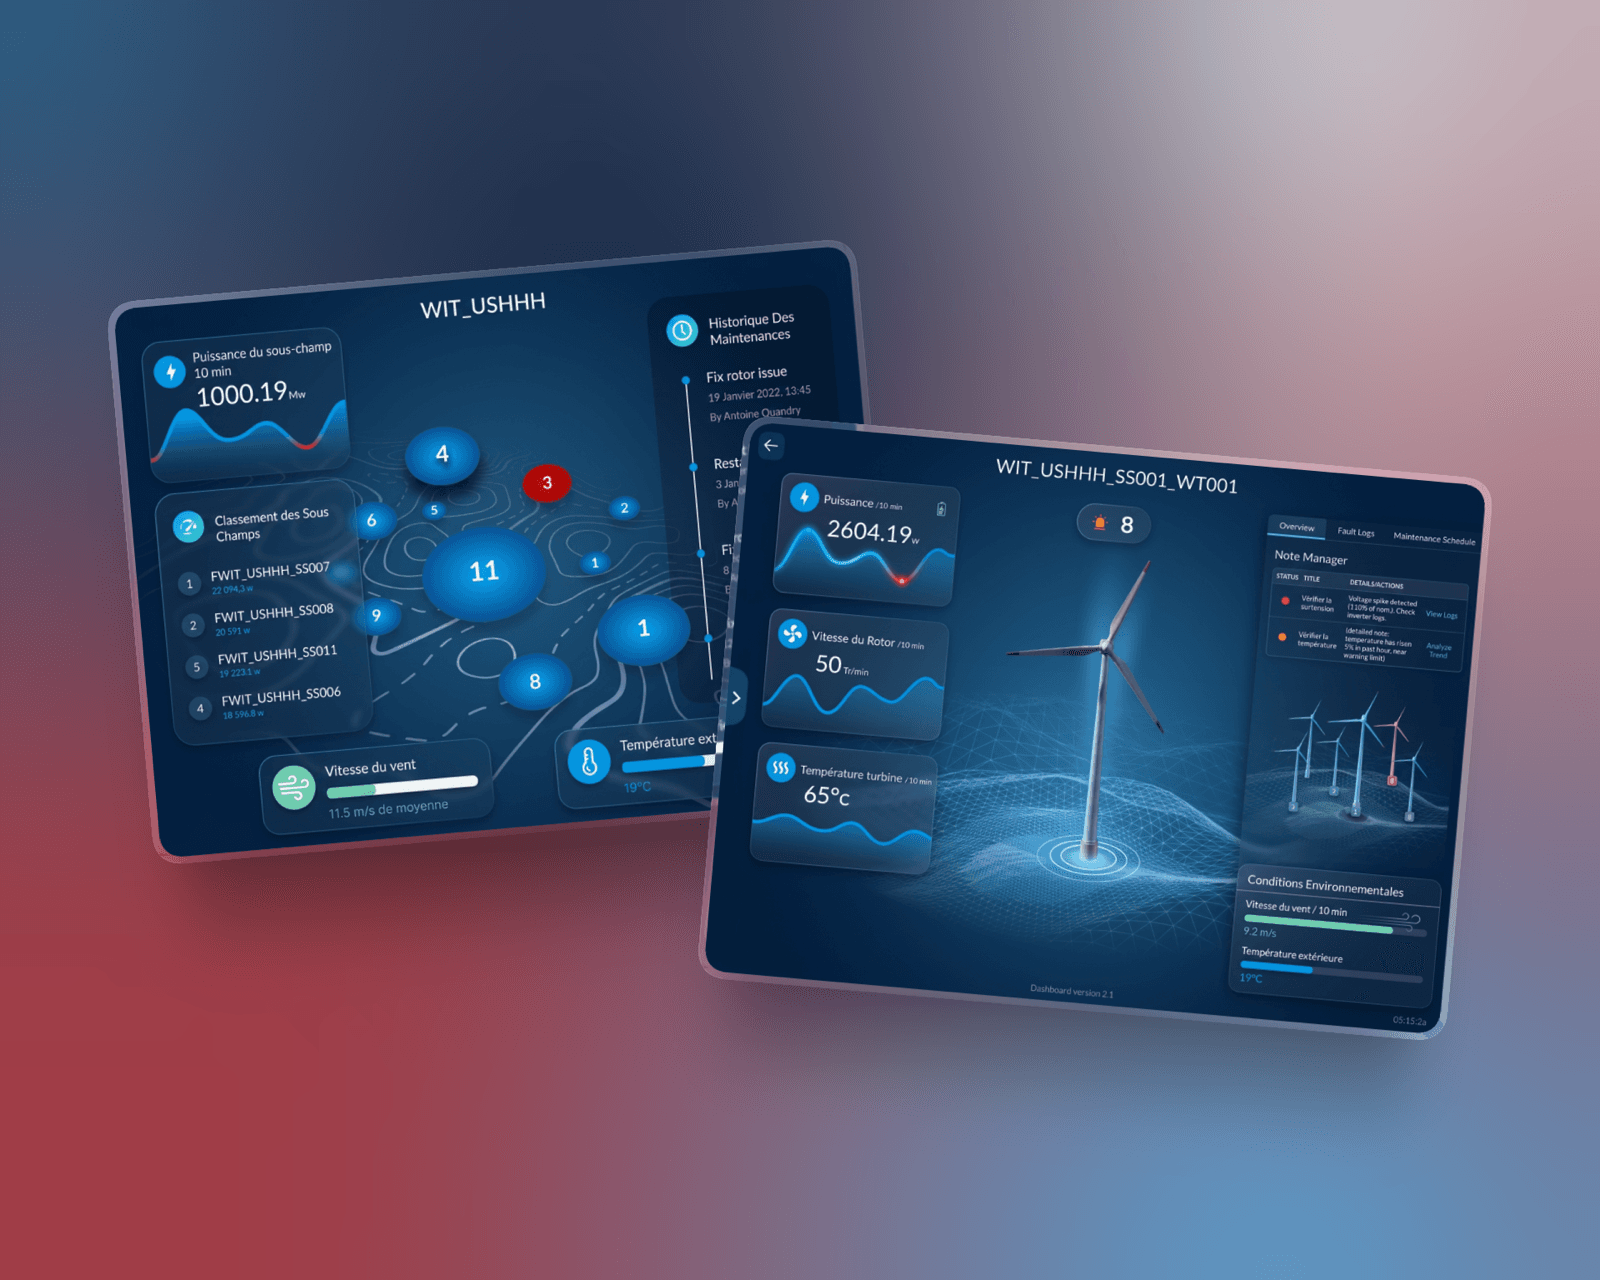
Plant managers and field agents work on the same turbines without ever seeing the same data: managers want an overview, agents want a clear link between an alarm and the action to take on site. In between, phone calls back and forth, and faults piling up faster than the farm grows.
Journey mapping for both personas, data visualisation of production, wind and temperature refreshed every ten minutes, an alert history classified by severity, and a direct channel — a note the plant manager sends the assigned agent straight from the turbine in question.
Faster diagnosis, and a note that replaces a phone call. The takeaway: in supervision you are not designing a dashboard, you are designing a hierarchy of urgency — the real problem was never the lack of data, it was the missing channel to act on it.
Next projectBPCE — Accessible banking appAn alert nobody acts on is not information. It is noise with a colour.